
The Party Representation and Care Gap
by Carah Ong Whaley, PhD
We now have a fourth month of respondent data for our Better Choices for Democracy and AlphaRoc 2026 Election Confidence Tracker, bringing the total across four months to 4,362 respondents. We are on a mission to move beyond the horse race and provide deeper analysis and data-driven insights on the electorate.
In the first analysis, I laid out a case that the crisis facing American democracy today is a crisis of representation. That is still true with the additional month of data we now have.
In this post, I’m going to dive deeper to provide some insights on the electorate. As a big transparency and accountability champion, I encourage you to dive into the data as well and share what you find with me (it’s why I’ve spent so many hours/days building an accessible dashboard).
The top lines remain stable with minor fluctuations. In June, 86% of respondents who are registered voters said they intended to vote in the November election, including 61% who said they already had a specific plan; 81.6% of all respondents are very or somewhat confident in the accuracy of the vote count; only 23% say Congress cares about people like them. In the open ends, concern over corruption and politicians lying remains at the top of the list of most important problems facing the United States, in addition to inflation, high cost of living, and economic insecurity.
With the additional data, I wanted to explore connections between confidence in the vote, representation, and the economic outlook of the electorate (check out the crosstabs explorer here). Here are key takeaways.
The Party Representation and Care Gap
The Party Representation and Care Gap is the disconnect between voters’ participation in elections and their belief that the political system is responsive to them. It exists when people do not believe that elected officials care what people like them think or that the major political parties adequately represent their interests.
These are two related but distinct dimensions:
The Care Gap measures whether people believe their members of Congress care what people like them think.
The PartyRepresentation Gap measures whether people believe the Democratic and Republican parties represent the interests of people like them.
While voters are confident in the accuracy of the vote count (see more below), they are not confident that the two major political parties, candidates and elected officials will translate their votes into responsive representation.
In June, nearly half of adults (48%) said their members of Congress cared only “a little” or “not at all” about what people like them think. Only 20% said members cared “a great deal” or “a lot.” That produces a 28-point Care Gap between those who feel largely unheard and those who feel strongly heard.
The Party Representation Gap is concentrated most clearly among independents. For independents, the representation gap is between voters and the two-party system itself. Neither party is viewed as representing them particularly well.
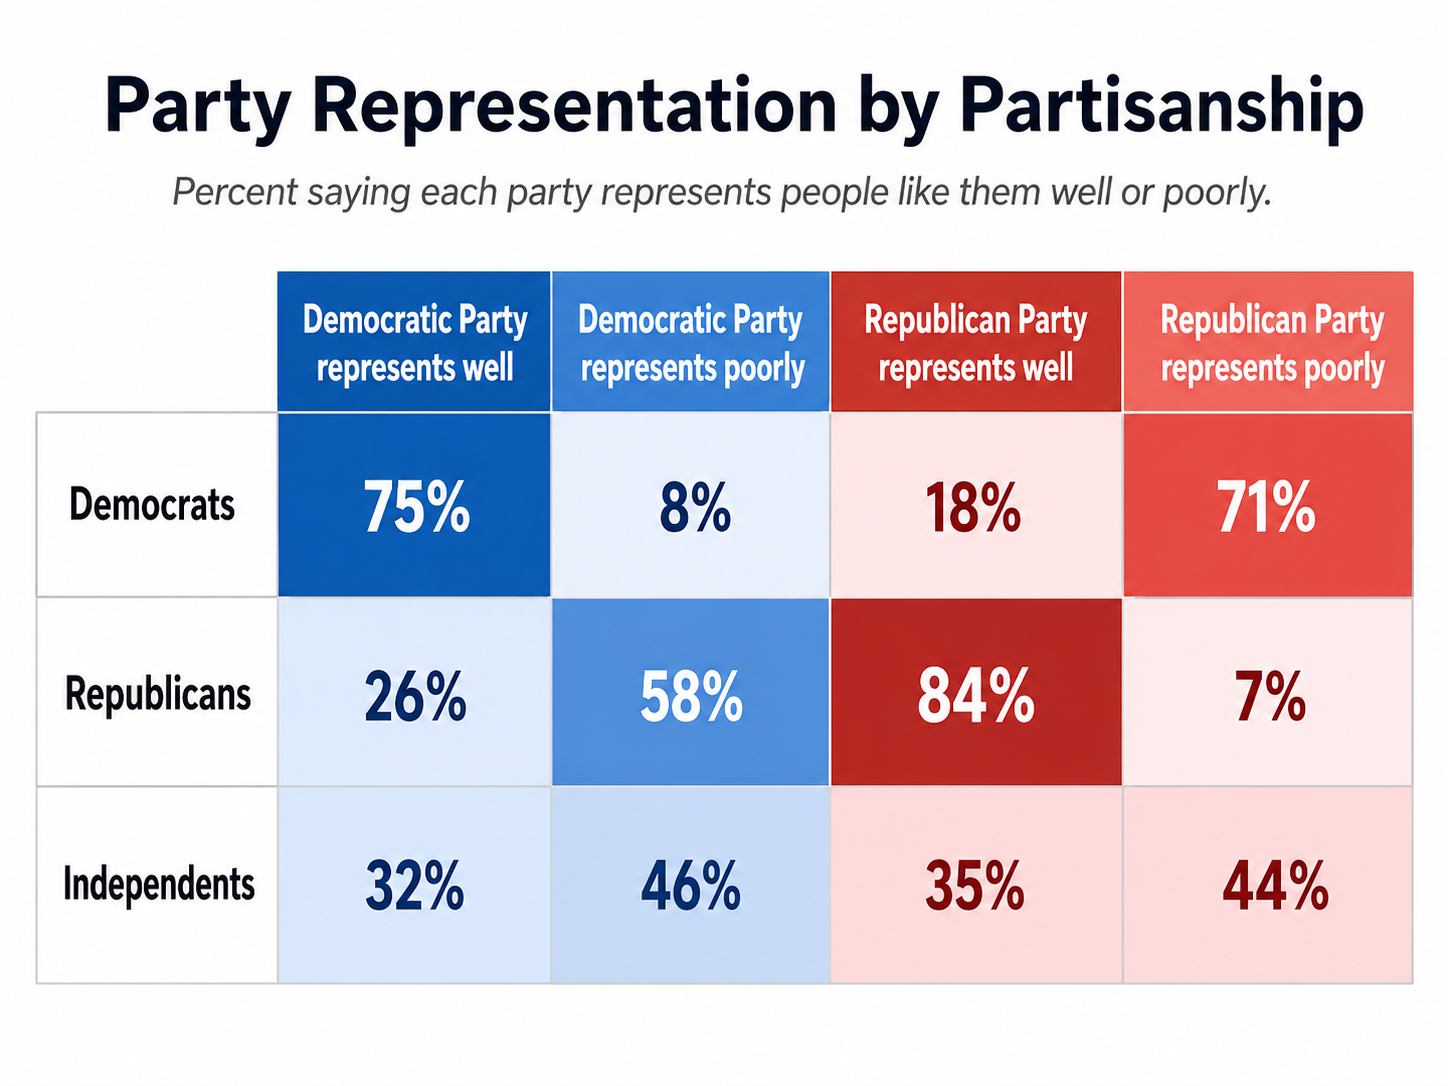
For Democrats and Republicans, the gap is primarily between the parties. Most feel represented by their own party and poorly represented by the other. However, this has significant implications in a moment when general elections are not competitive. Minority-party voters in a safe district are represented by a party they believe does not reflect their interests, without a viable general-election mechanism for changing the outcome. That turns partisan disagreement into a structural problem:
Republicans in safely Democratic districts may feel permanently excluded.
Democrats in safely Republican districts may feel permanently excluded.
Independents may feel that neither the dominant party nor its nominal opponent competes seriously for them.
This also weakens electoral accountability. Competitive elections ordinarily give representatives a reason to retain support beyond their most loyal base. When the district is effectively secured for one party, incumbents may face less pressure to appeal to cross-pressured voters, independents or members of the other party.
Perhaps one of the most significant findings is that the Party Representation and Care Gaps are not a measure of voter apathy. Among people who already have a specific plan to vote, 49% say Congress cares only a little or not at all. And among voters who are very confident that local votes will be counted properly, 45% say Congress cares little or not at all. Among those saying the Democratic Party represented them “not at all well,” 87% intended to vote. Among those giving the Republican Party the same rating, 83% intended to vote.
Confidence in local vote counting accuracy remains high and is closely connected to participation
In June, 86% of registered voters were confident that votes in their county or city would be counted as voters intended. Confidence has remained broadly stable since March, fluctuating between 80% and 85% among all adult respondents.
The crosstabs show an especially strong association between confidence and voting readiness:
Among people with a specific voting plan, 92% were confident their votes would be counted properly.
Among those intending to vote but without a plan, 87% were confident.
Confidence fell to 56% among people unsure whether they would vote.
Among those who did not plan to vote, only 23% were confident.
The data doesn’t establish causation: confidence may encourage participation, participation may strengthen familiarity with election administration, or both may reflect broader political engagement. The relationship between intention to vote and confidence in the accuracy of the vote count is nevertheless strong.
Economic outlook is deeply connected to whether voters feel heard
Perceptions of congressional responsiveness vary sharply with expectations about household finances. Among people who believe Congress cares a great deal about people like them, 59% expect their finances to improve and only 9% expect them to worsen. Among those who believe Congress does not care at all, only 18% expect improvement, while 38% expect their finances to worsen.
Economic pessimism and political alienation appear to reinforce one another. Voters who expect their financial circumstances to deteriorate are much more likely to believe elected officials are not listening.
Economic uncertainty is more strongly associated with disengagement than either optimism or pessimism. Among people unsure what will happen to their finances, only 52% intend to vote; 30% percent say they do not plan to vote. By comparison, at least 81% of those expecting their finances to improve, remain stable or worsen intend to participate.
Voters who expect hardship may still be politically motivated. Those who feel economically and politically unmoored are much more likely to disengage.
The largest participation gaps concern readiness and resources
The June results show substantial differences in who has converted an intention to vote into a specific plan.
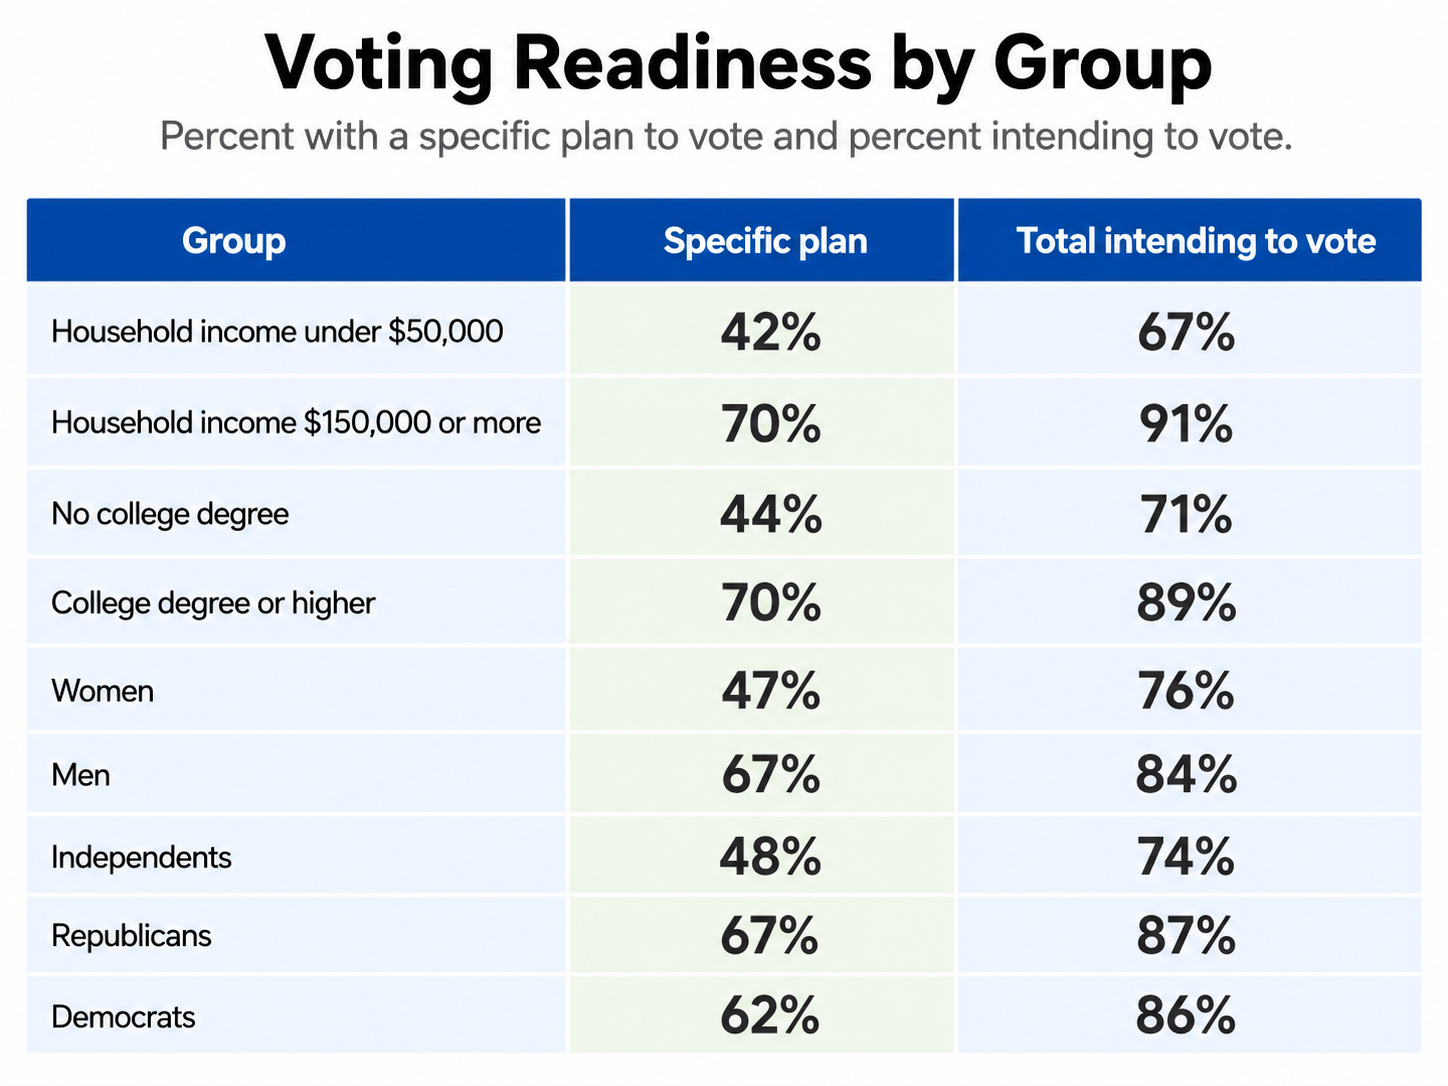
Among adults age 65 and older, 74% had a plan and 93% intended to vote. Among adults under 30, only 34% had a plan and 70% intended to vote. More than one-third of younger adults (36%) said they intended to vote but had not yet made a plan. Similar gaps appear across income, education and gender.
Confidence follows a similar pattern. In June, 70% of adults under 30, 69% of those earning less than $50,000 and 74% of those without a college degree expressed confidence in vote counting. Confidence exceeded 88% among seniors, college graduates and adults earning at least $150,000.
Many people in the less-prepared groups intend to vote but have not yet converted that intention into a concrete plan. The participation challenge can be addressed by helping younger, lower-income, less-educated, independent and female voters move from general intention to concrete action through intentional outreach and education efforts.
I will continue to dive into the data because there is so much in it. I’m also looking forward to teaching an elections course in both a summer session at the University of Virginia and in the Fall, and can’t wait to see what the students surface. I hope you will dive into this data as well let me know what you find!